Integrate
Building a data dashboard for K-12 administrators
Overview
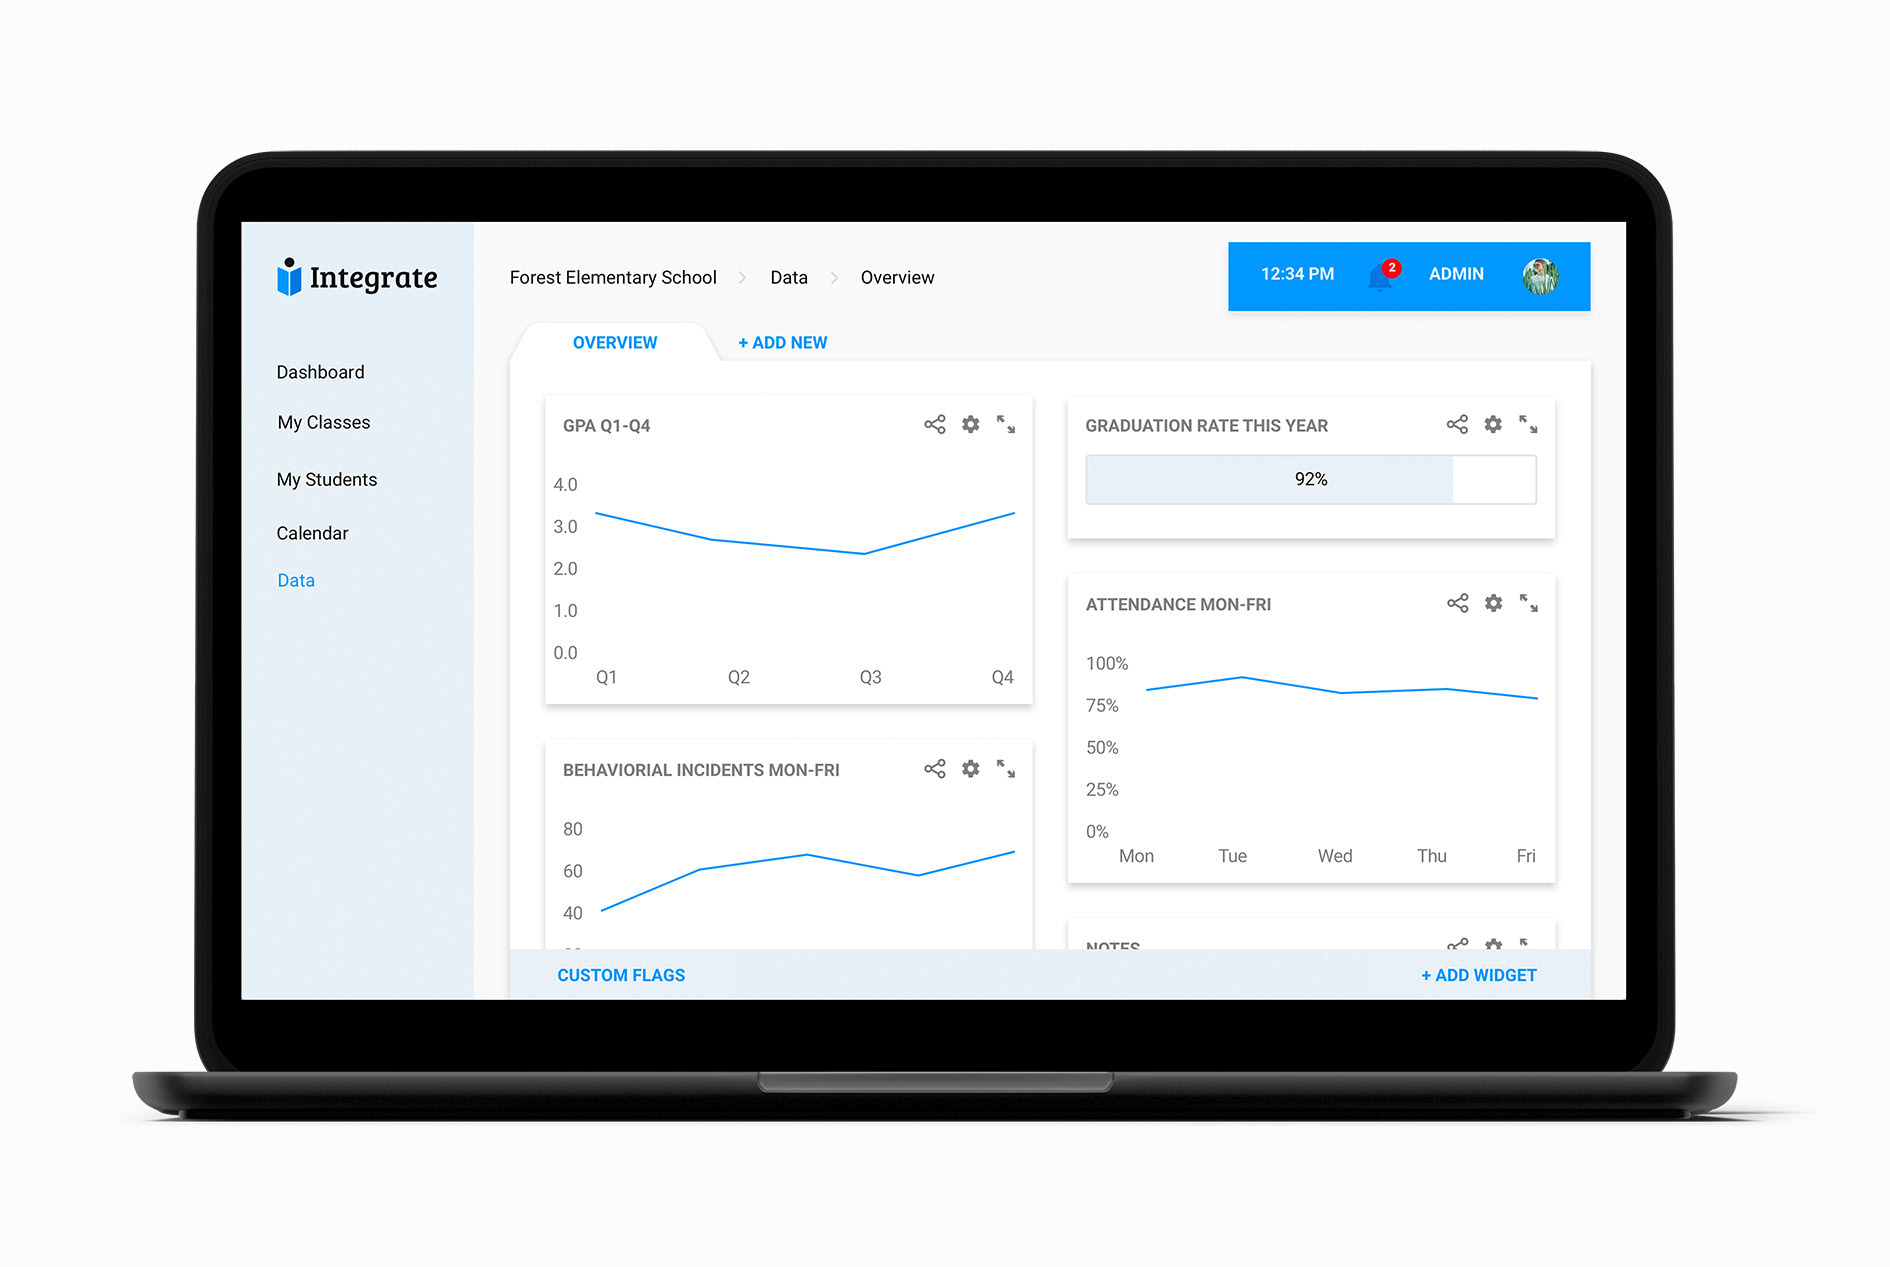
Integrate is an all-in-one software solution for K-12 schools that consolidates the functions of disparate educational management tools.
Challenge
- Design a data and analytics tool to help K-12 administrators better manage their schools and track information about their students, balancing administrative needs with student well-being
Solutions
- A lightweight, intuitive, and customizable dashboard including widgets, benchmarking, and notifications
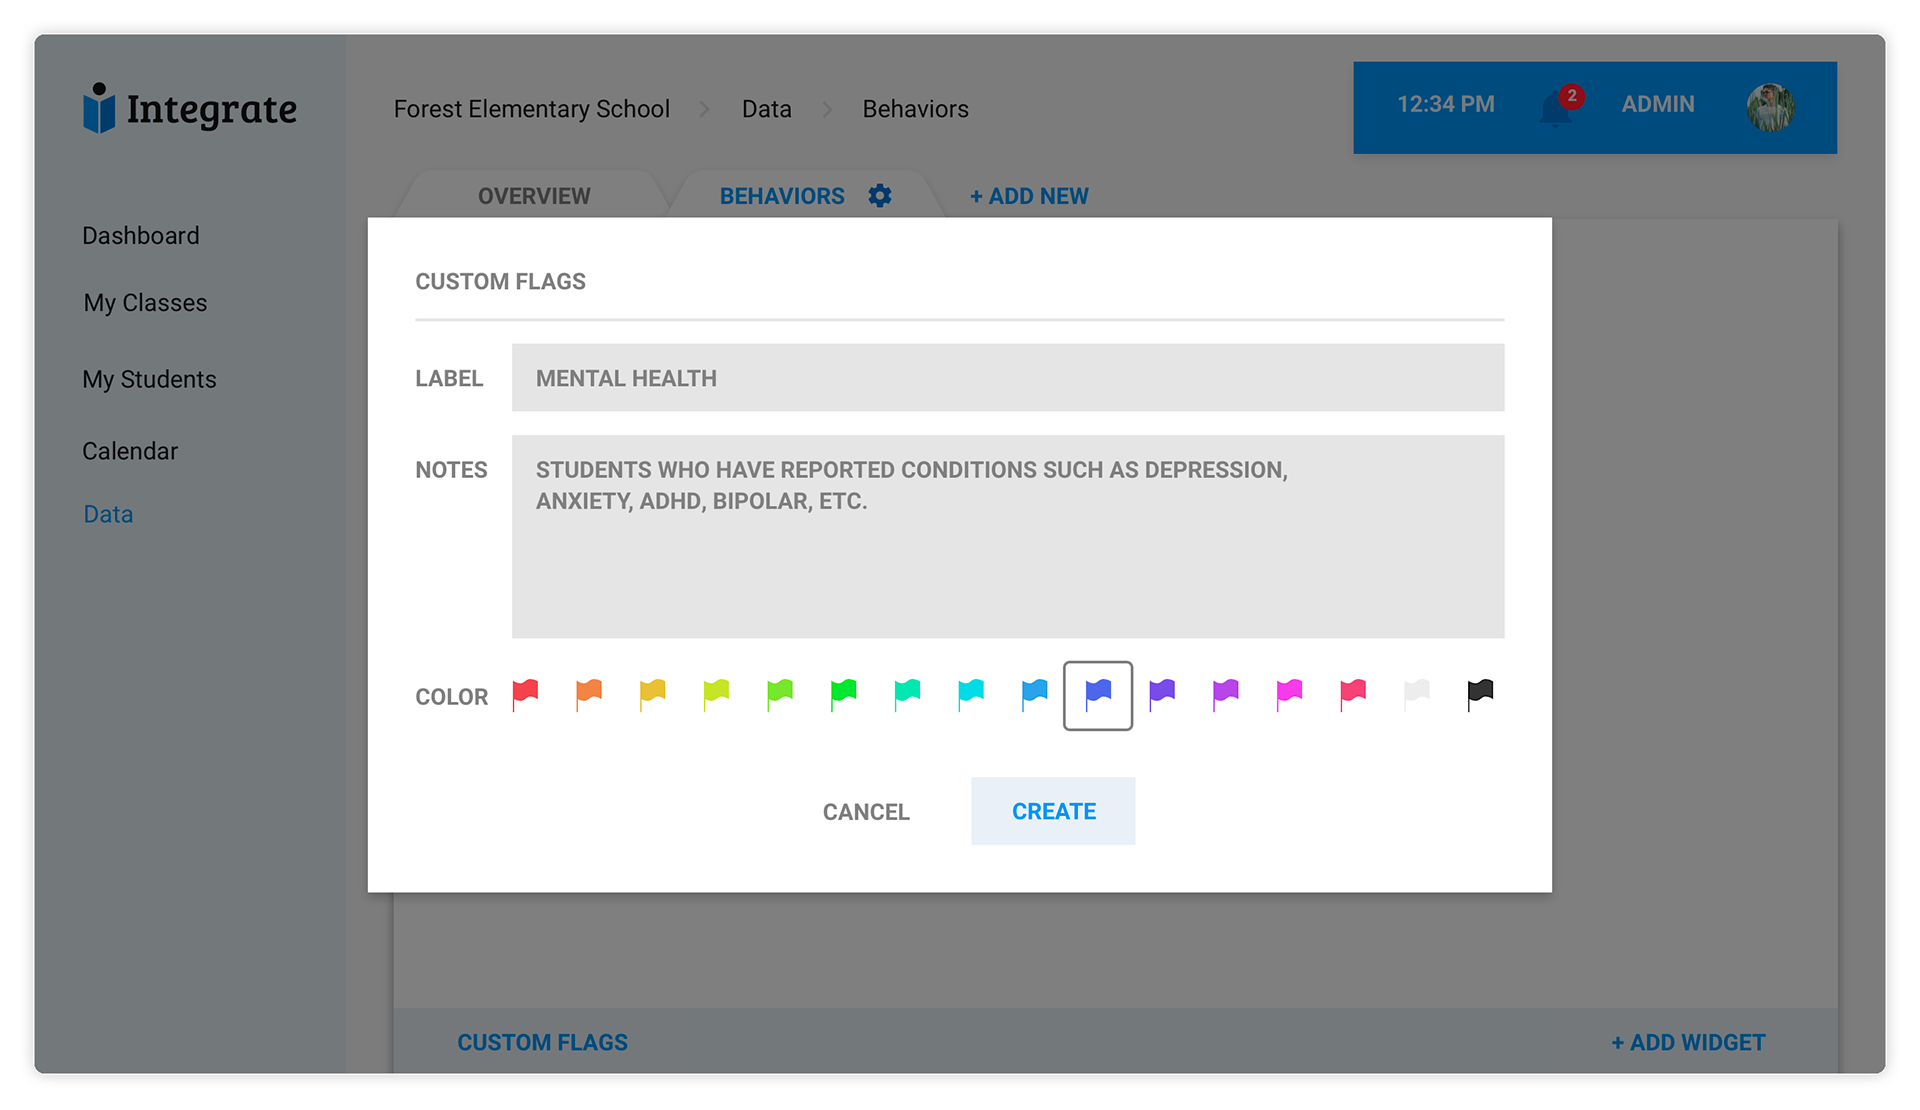
- Custom flags for the tracking of user-defined metrics
Team
Sharone Bloom, Eduardo Crespo, Melissa Gerson
Research
Integrate was lacking a data and analytics tool for administrators. The team set out to understand their needs and competitors's ways of addressing these.
Competitive Analysis
The team looked at data and analytics tools offered by competitors in order to understand the playing field and ways in which Integrate could position itself amongst them.
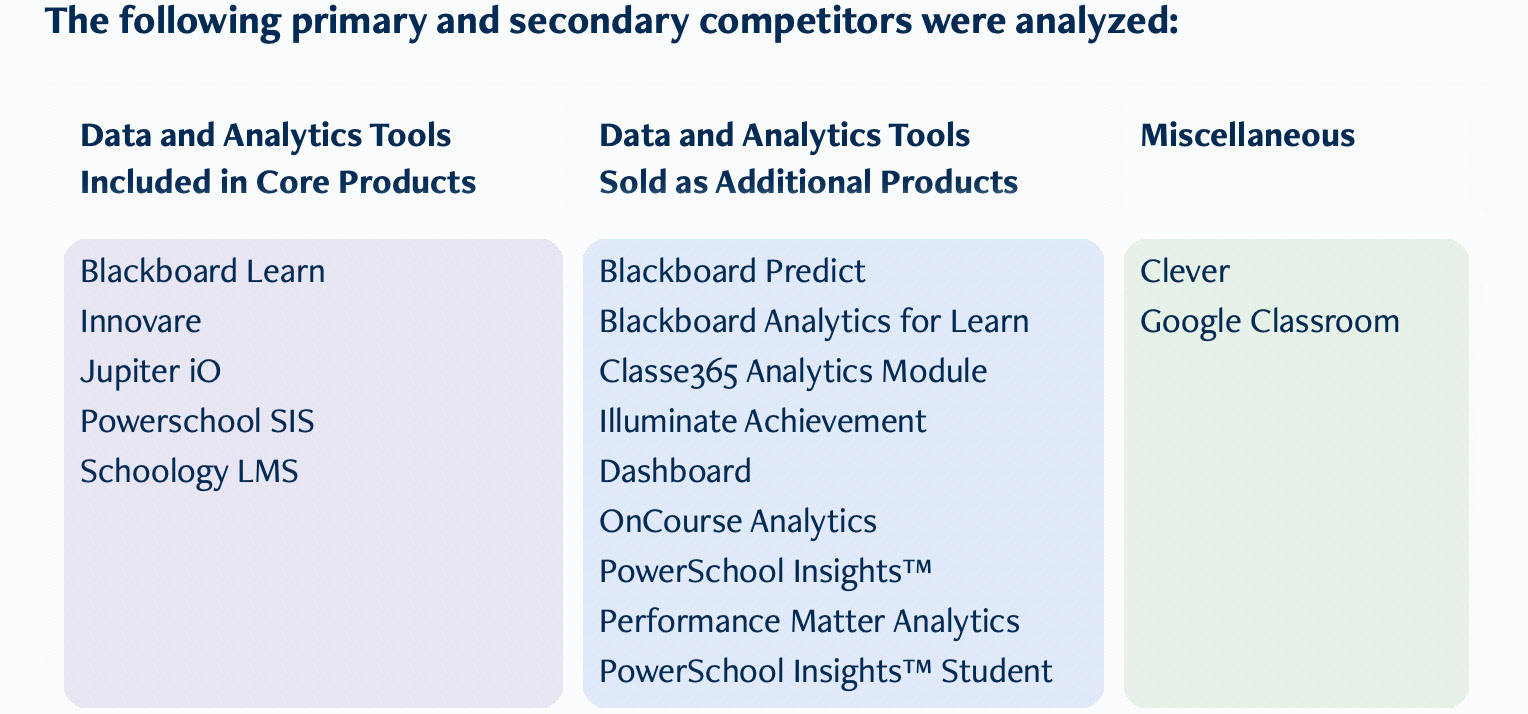
What we learned:
The simplicity of Integrate's interface and blending of functions could be leveraged. A moderately complex yet clear, easy-to-use tool appeared as a way forward.
Interviews & Synthesis
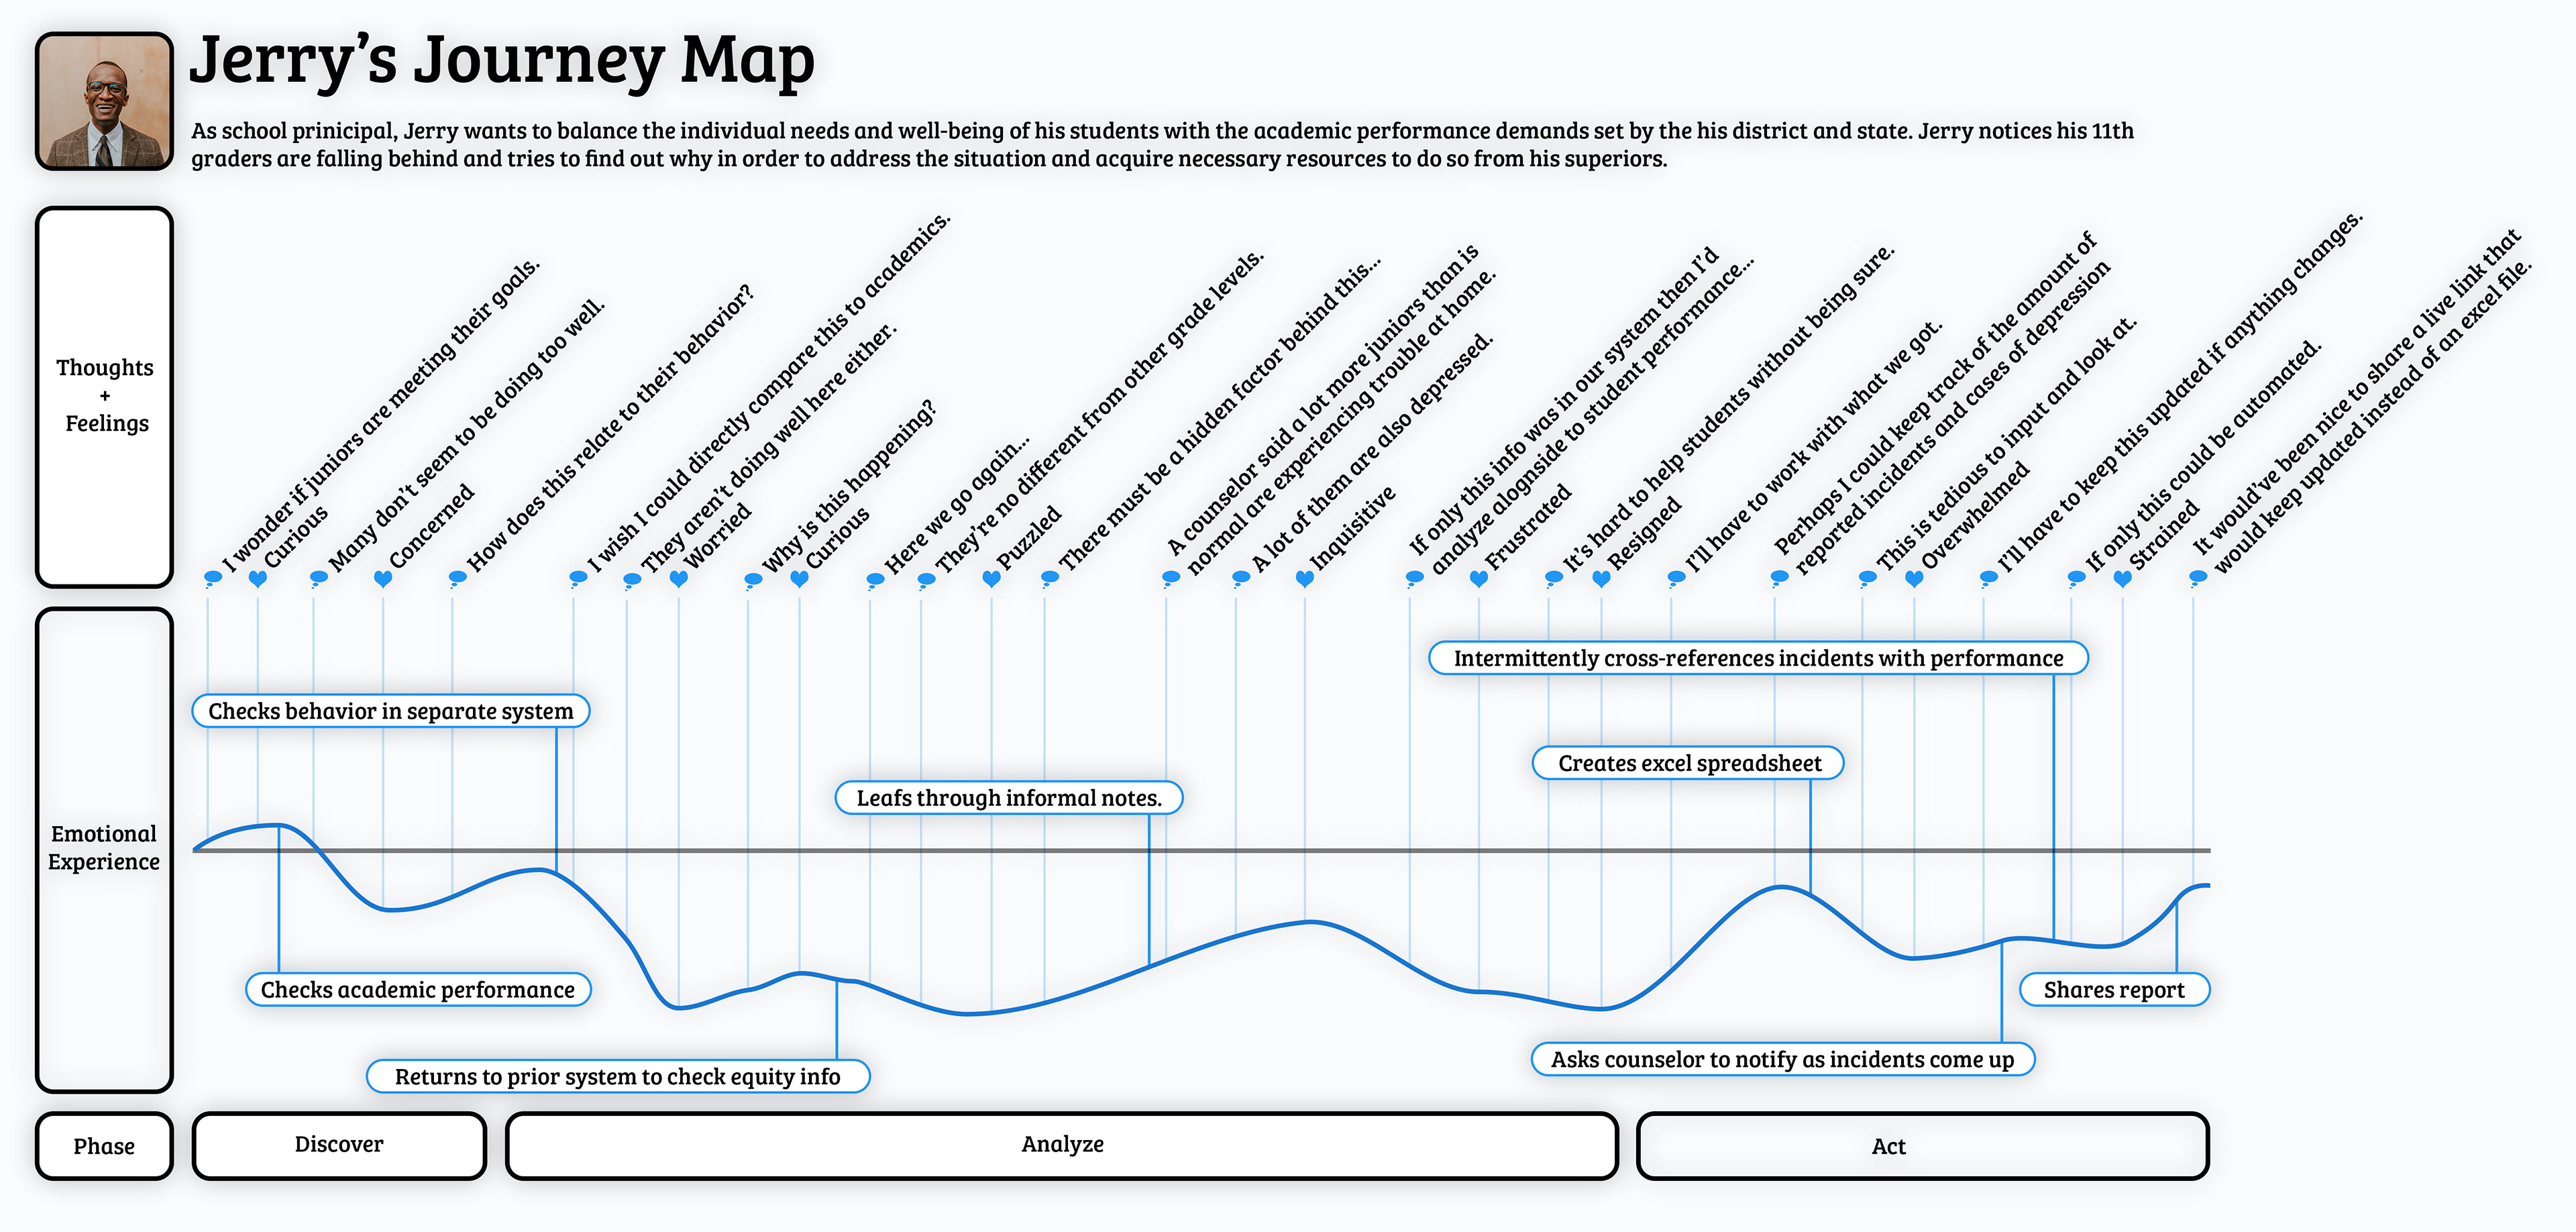
School administrators were interviewed by the team with the aim of learning about their experiences with educational software and what sorts of information they value when managing their schools.
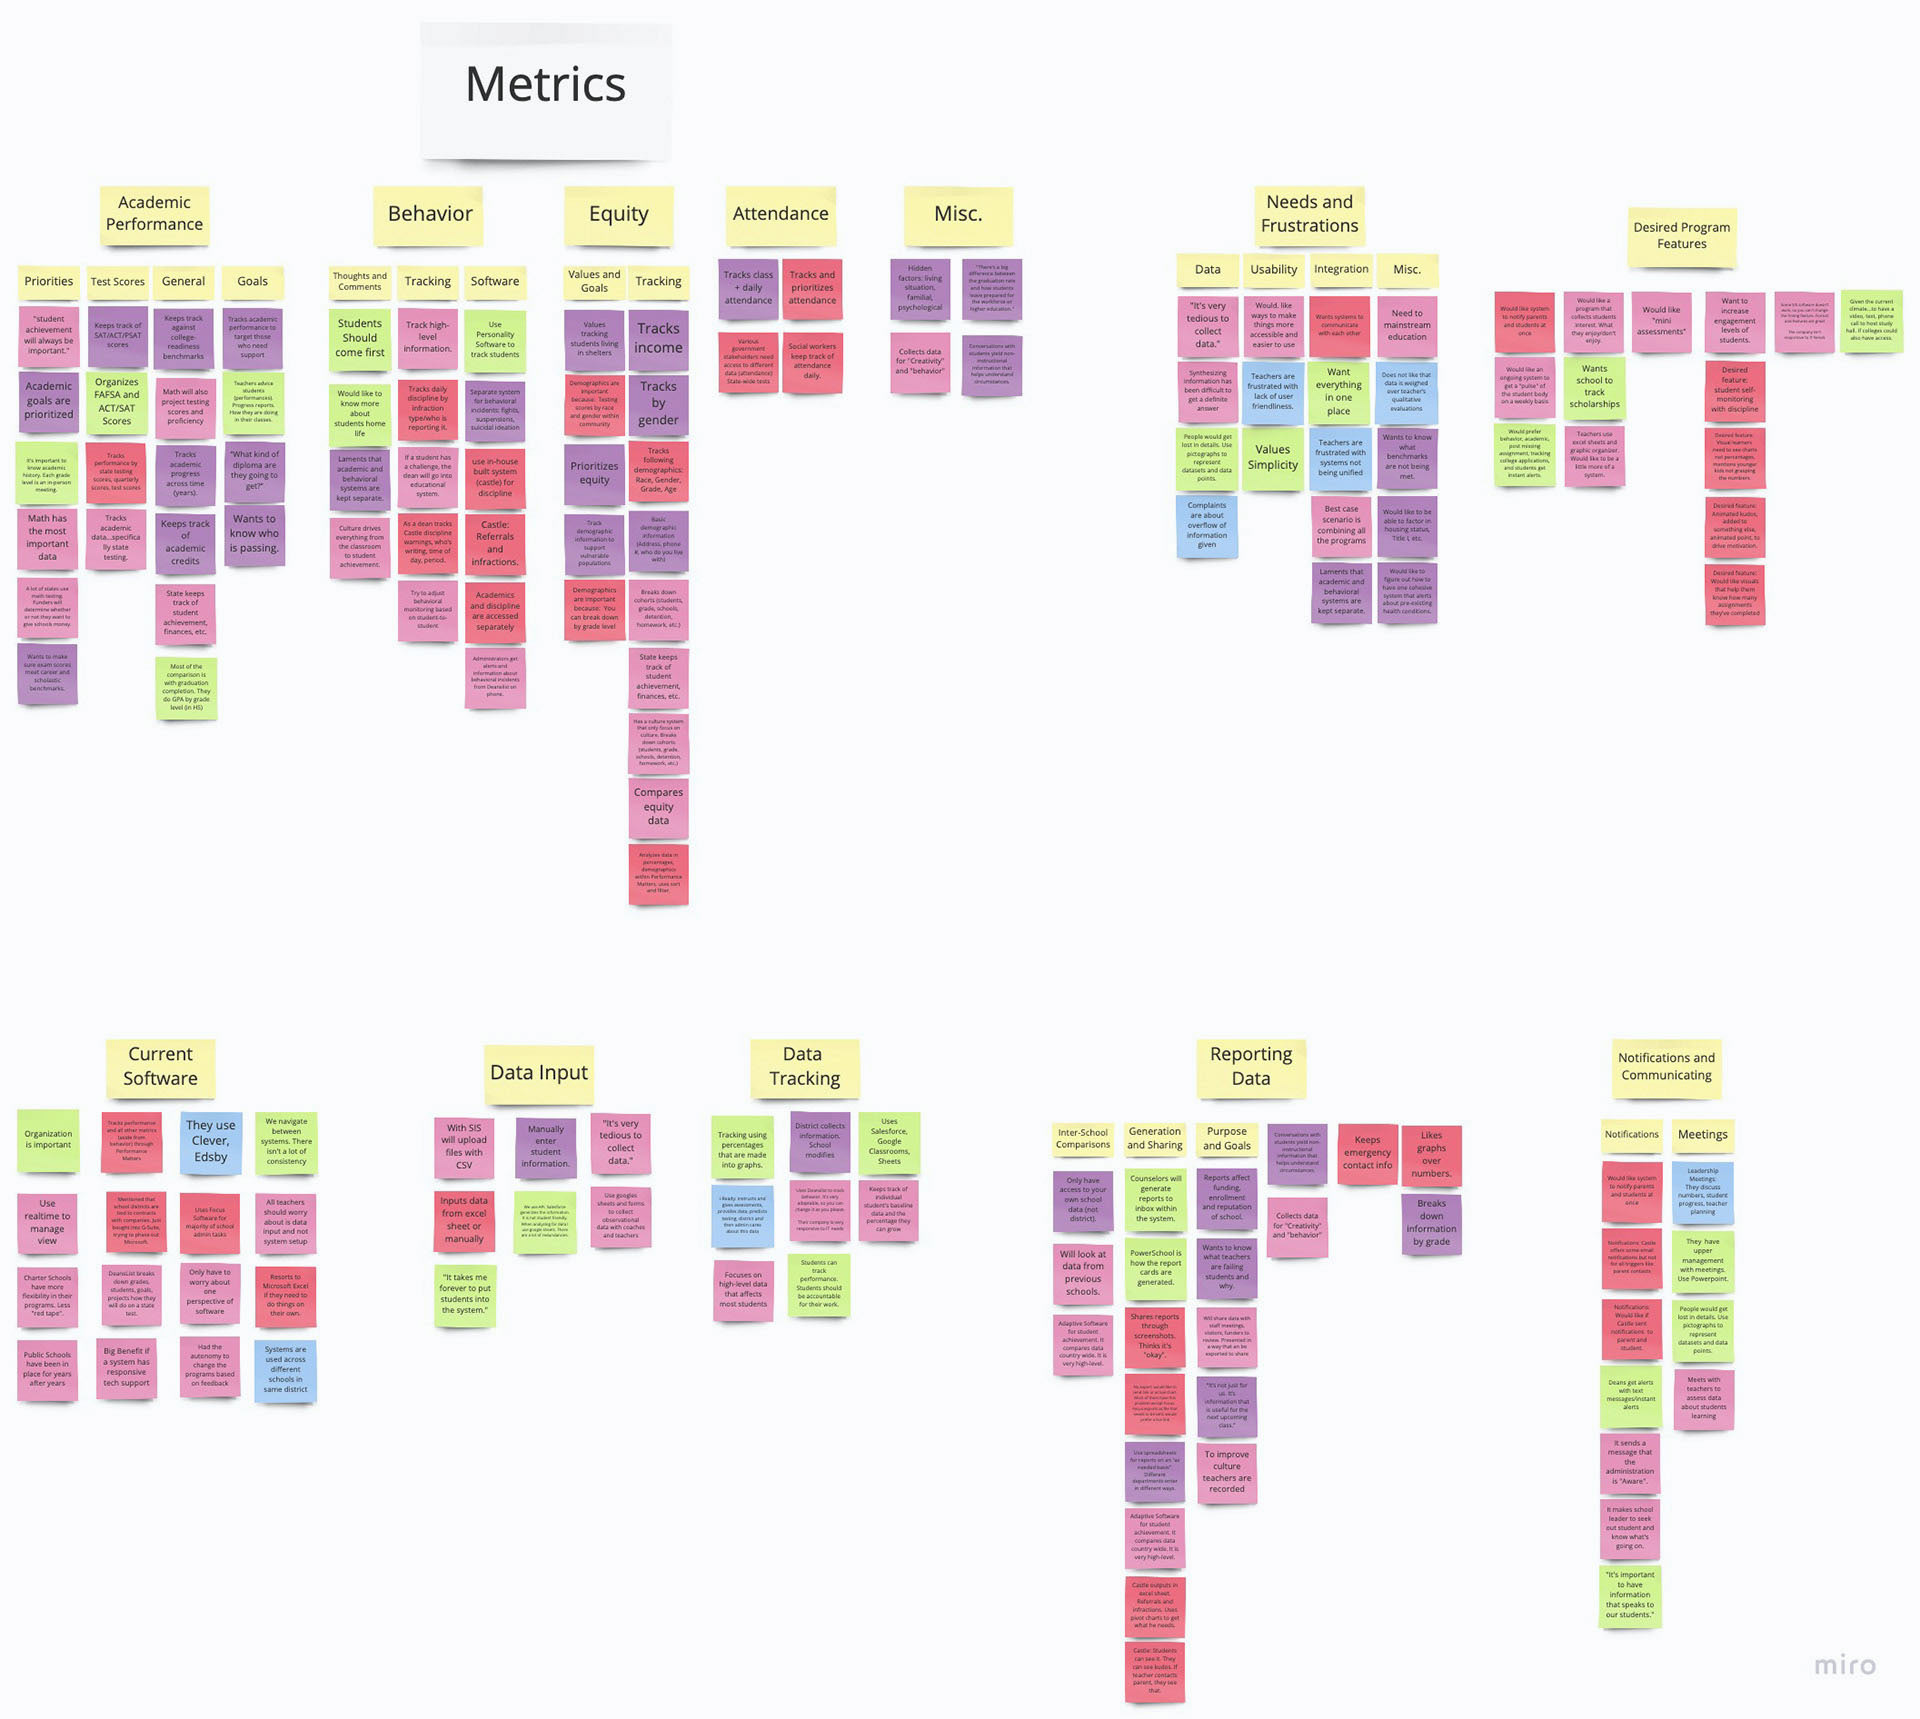
The findings were all synthesized into a persona and a corresponding user journey map:
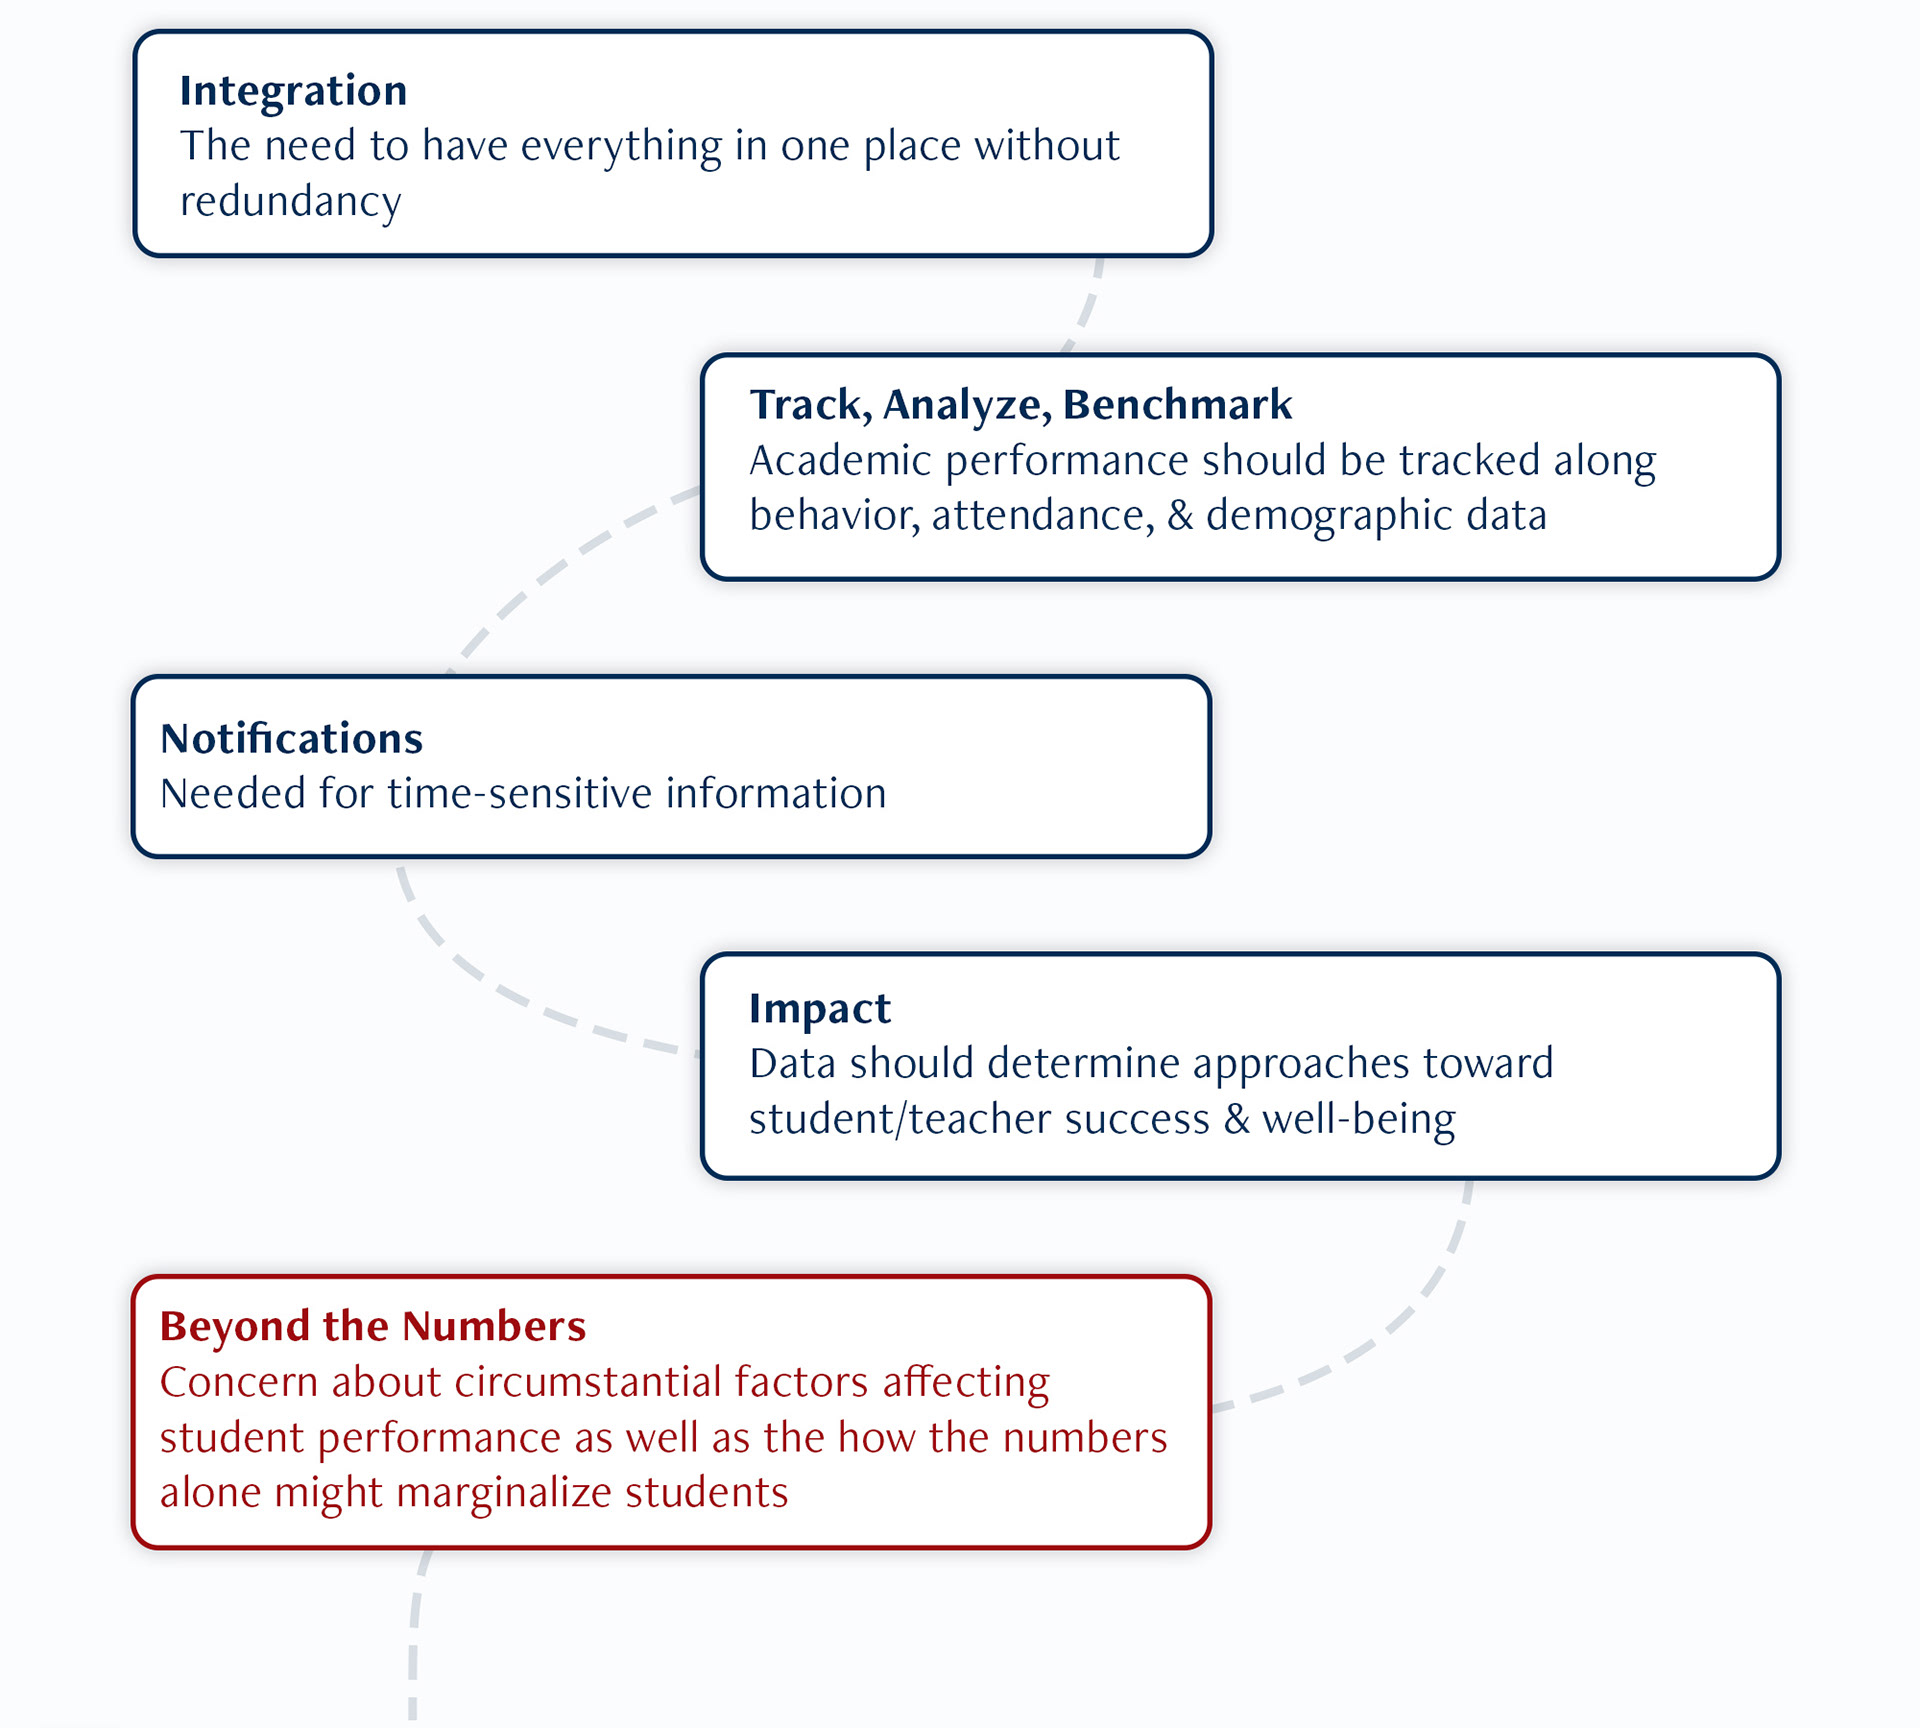
Design
The team set out to design for core needs uncovered in research; including those regarding of students's life circumstances beyond the metrics.
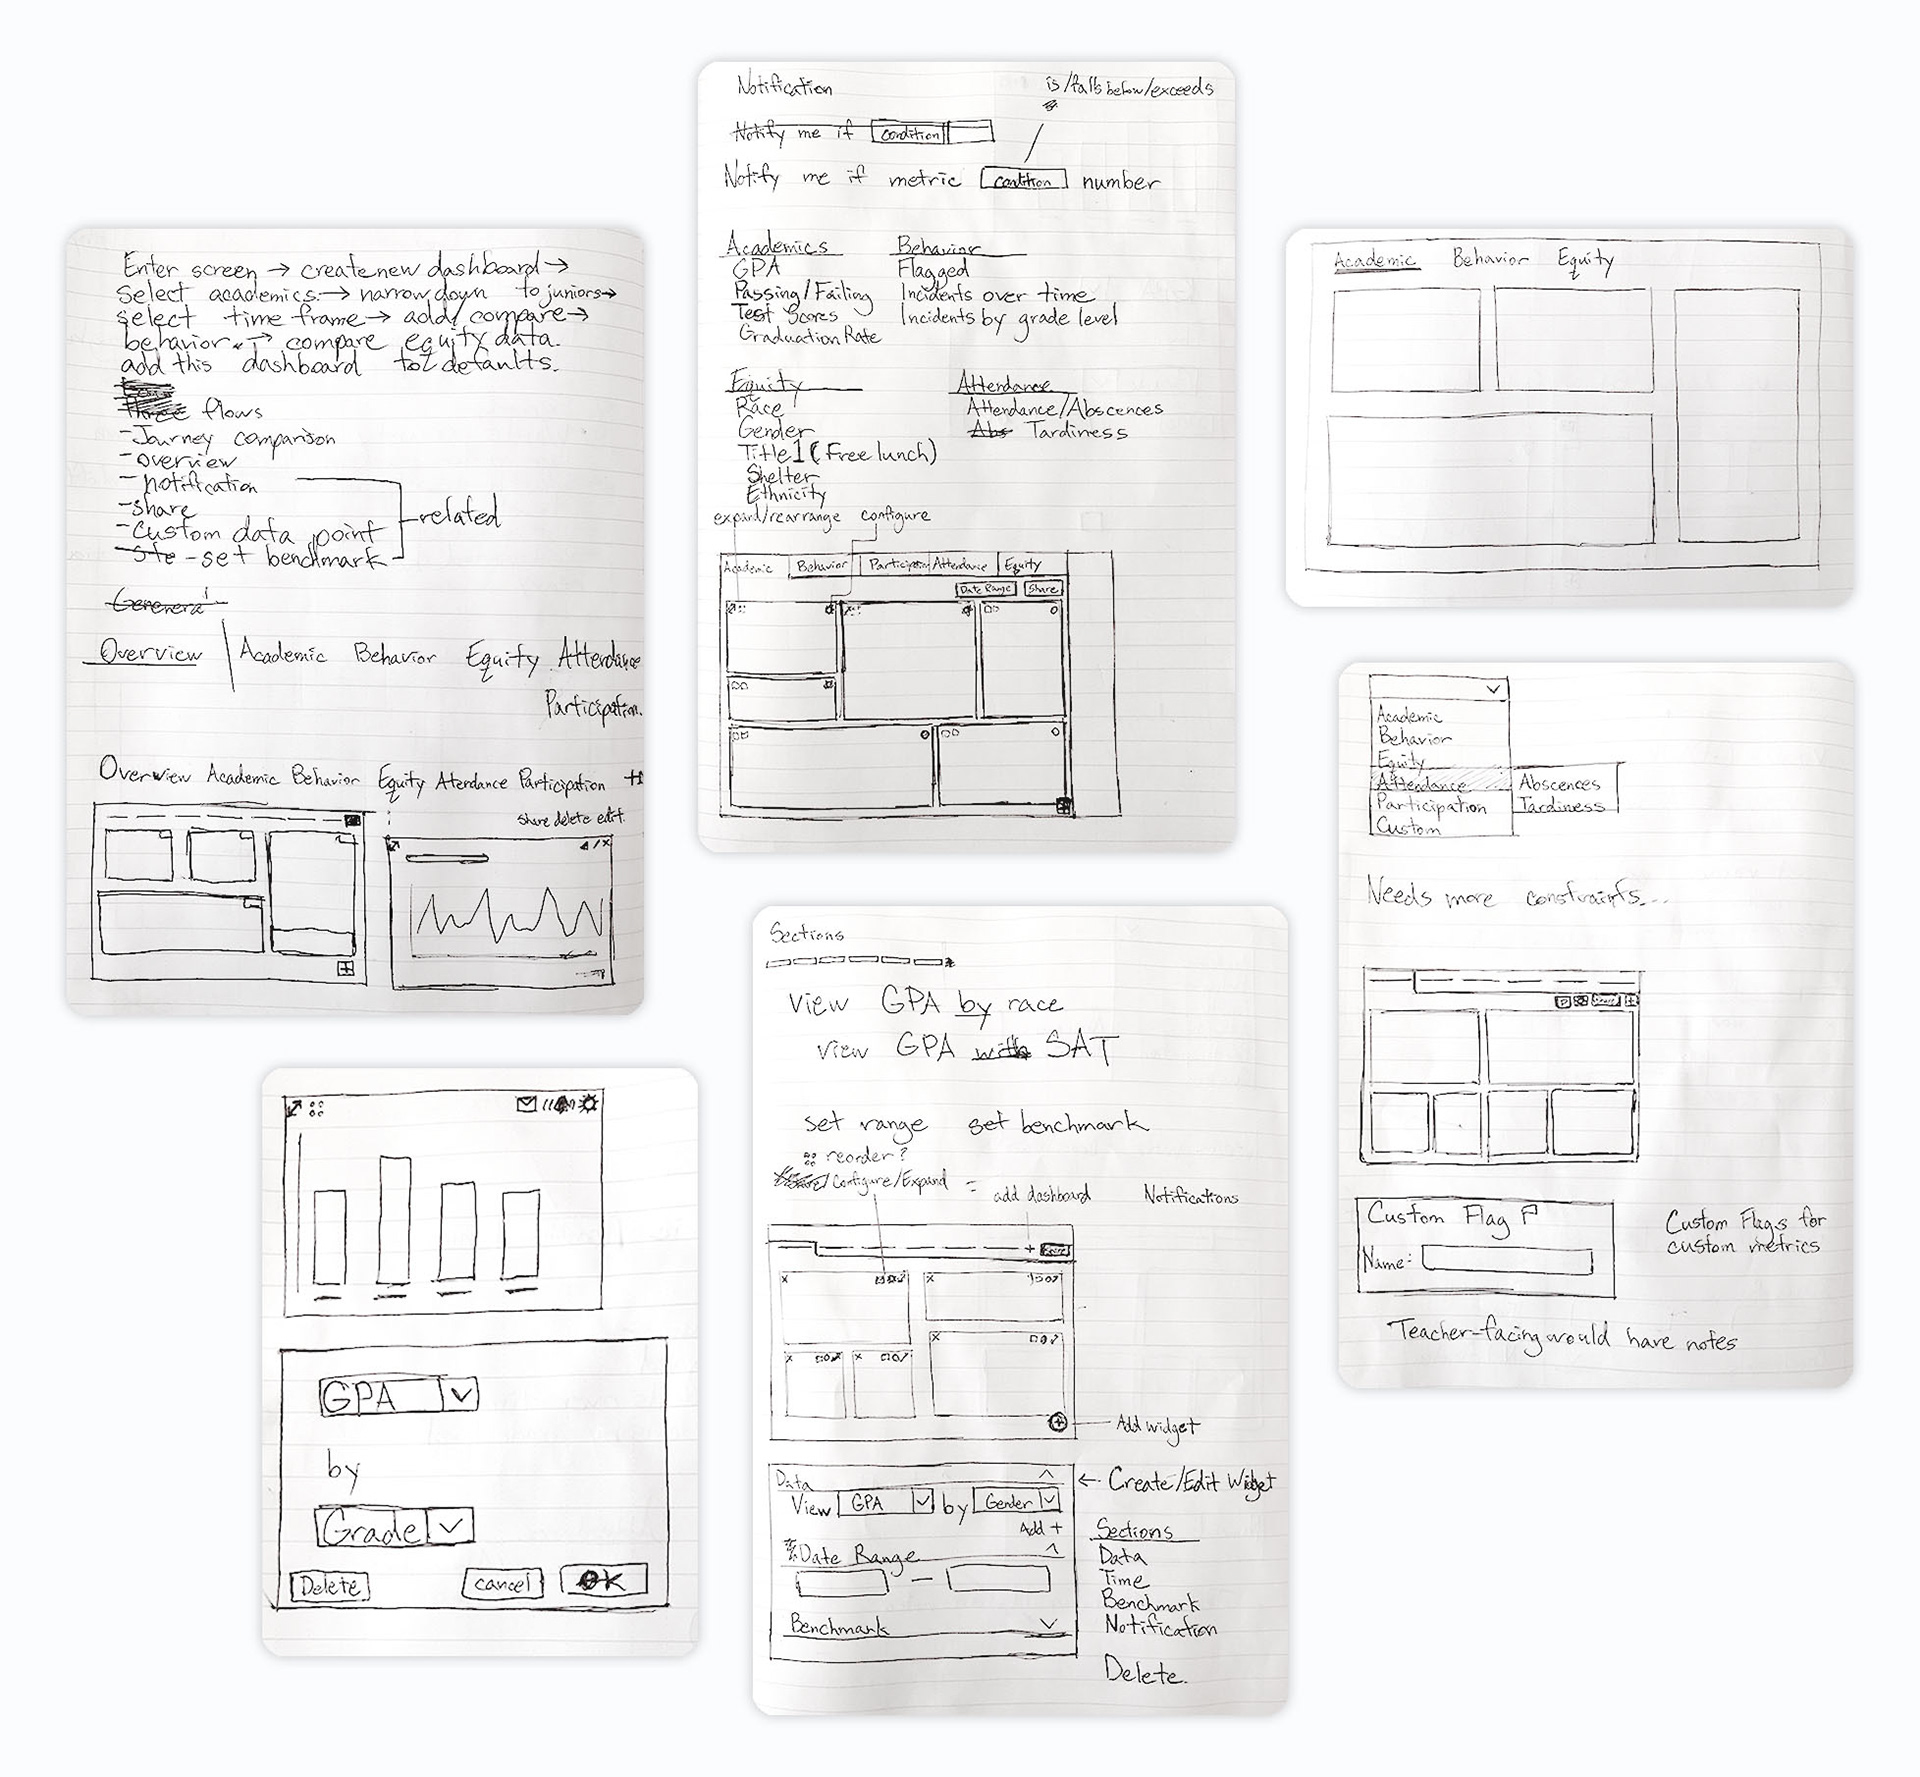
Ideation
Team members created their own sketches around which we discussed and picked features to include.
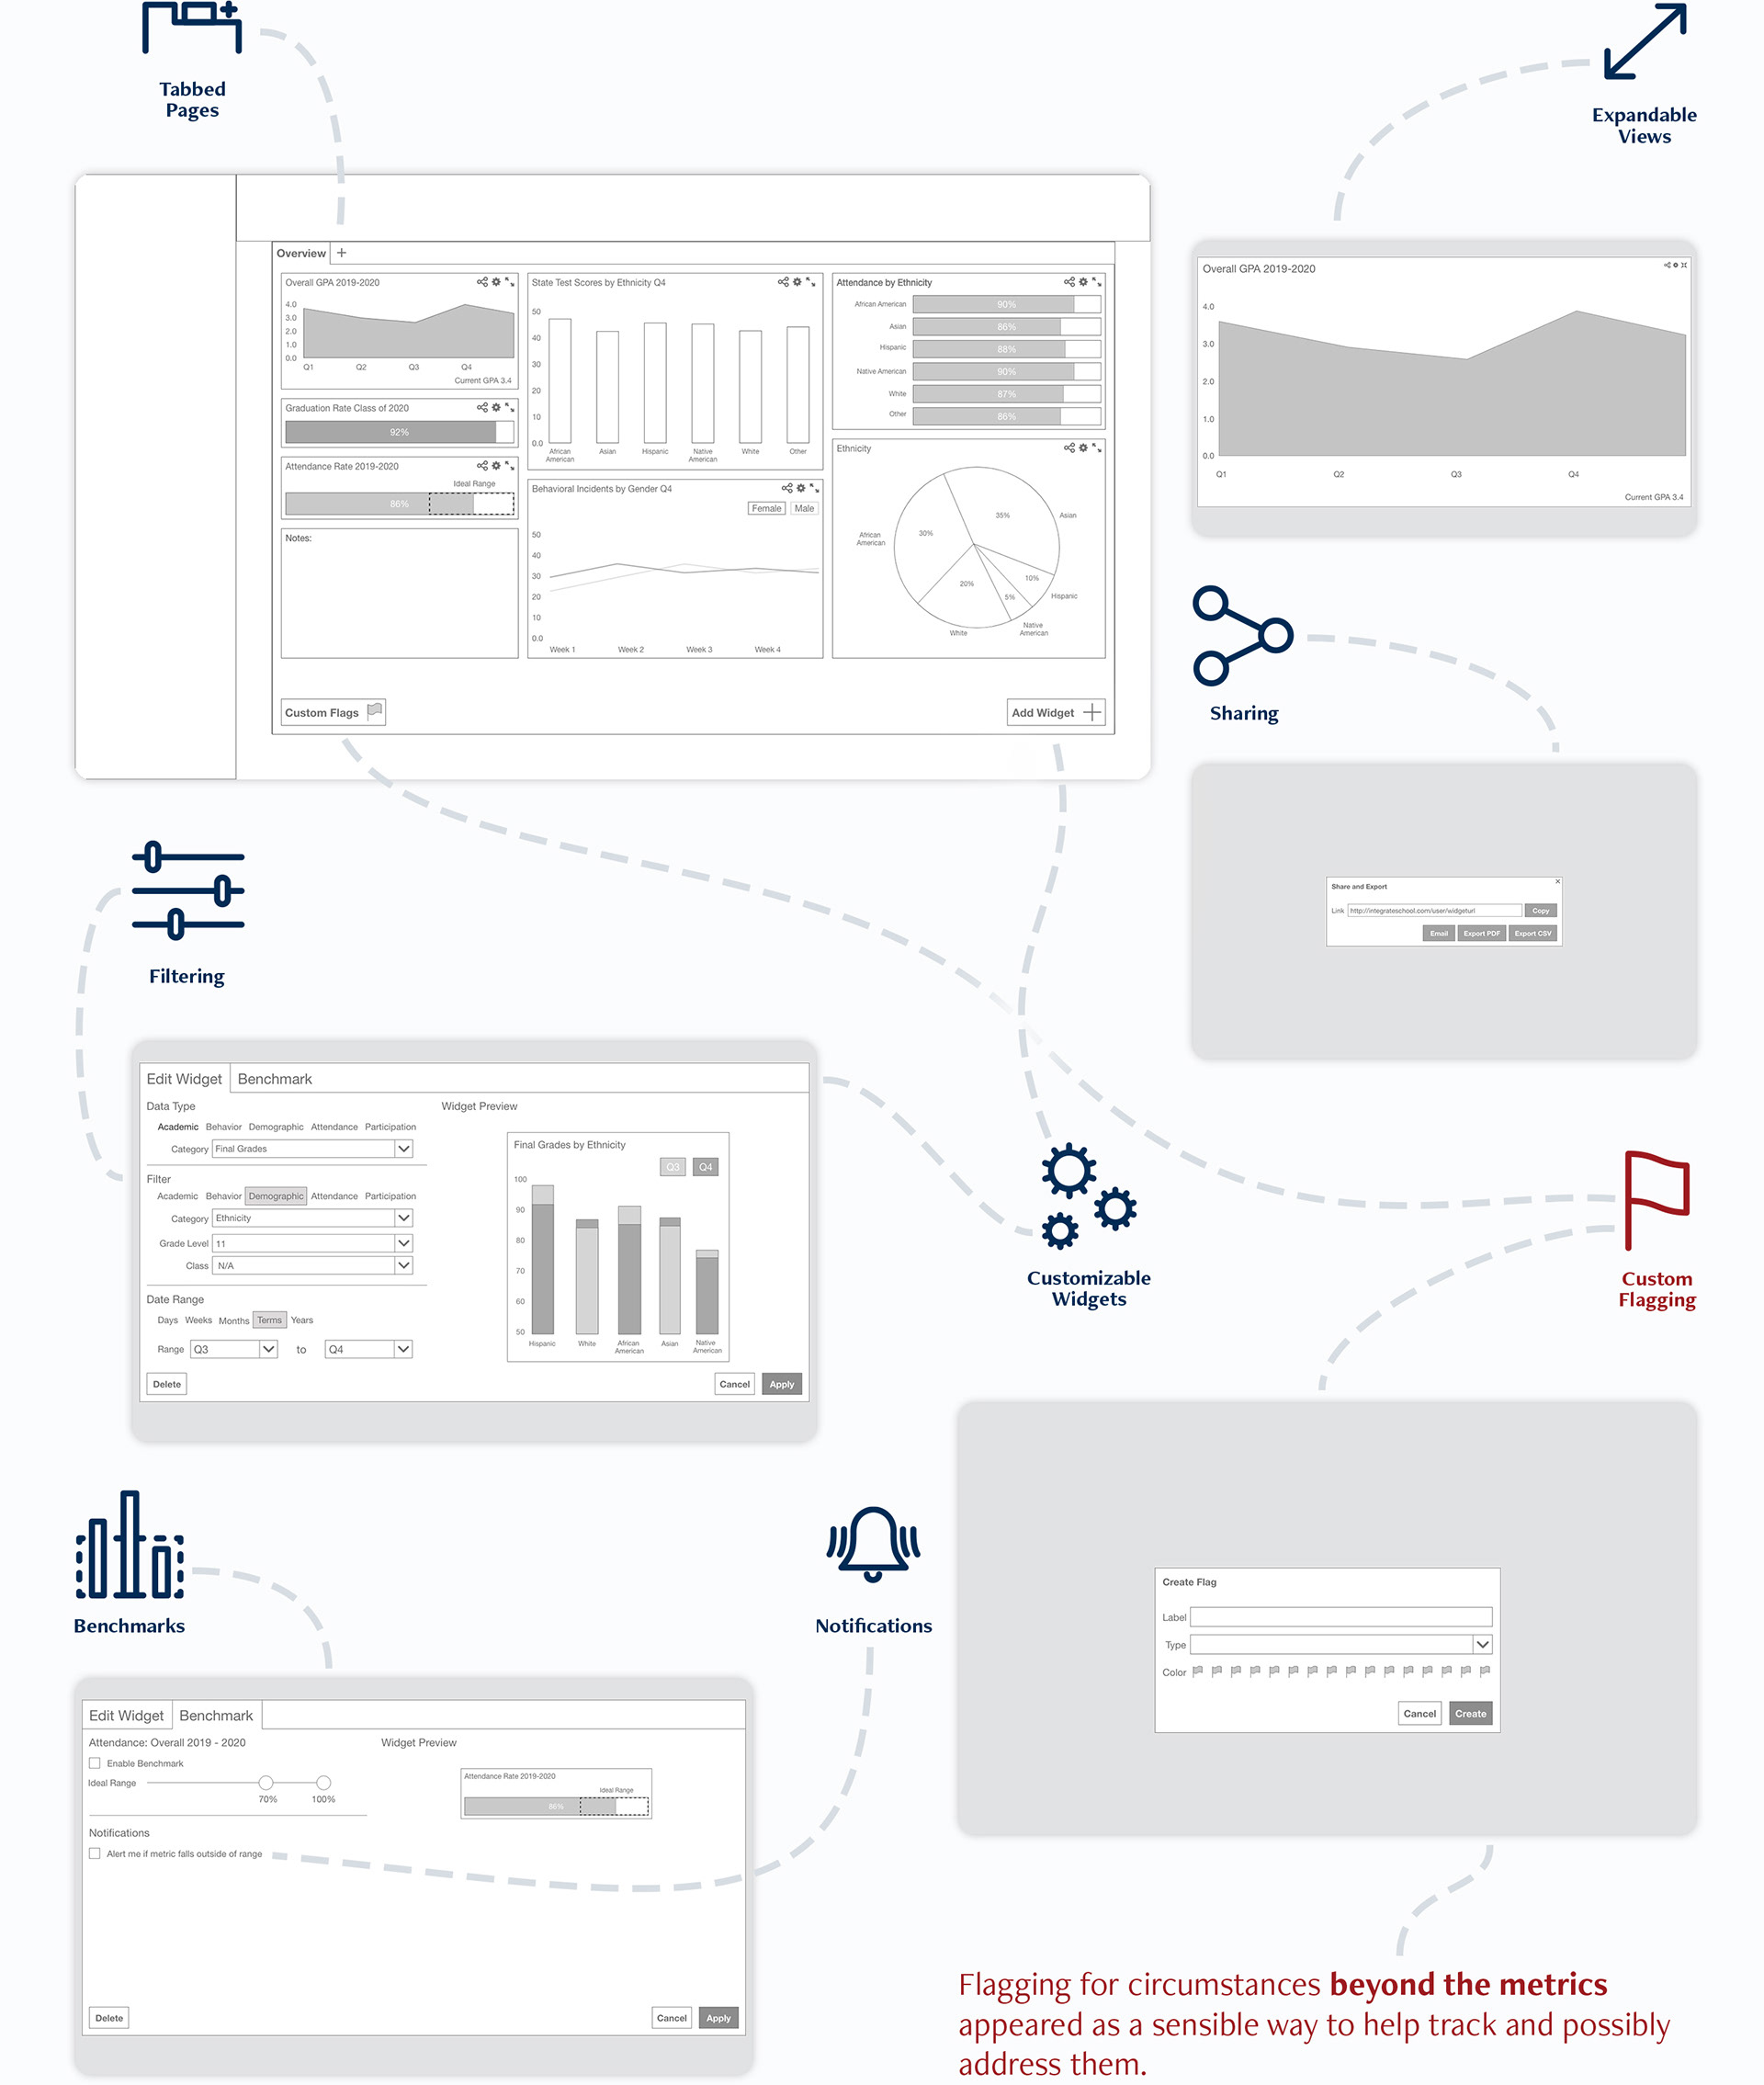
Wireframes and Prototype
With ideas locked-in, the team devised wireframes and a prototype.
User Testing
Issues were uncovered regarding discoverability of benchmarking and the relevance of the preset widgets.
Though the flags fared well, they were found to be wanting more detailed information.
Changes were made to address these concerns in a second prototype which began to be tested. However, the tests had to cut short at the client's request and we moved straight into the final prototype.
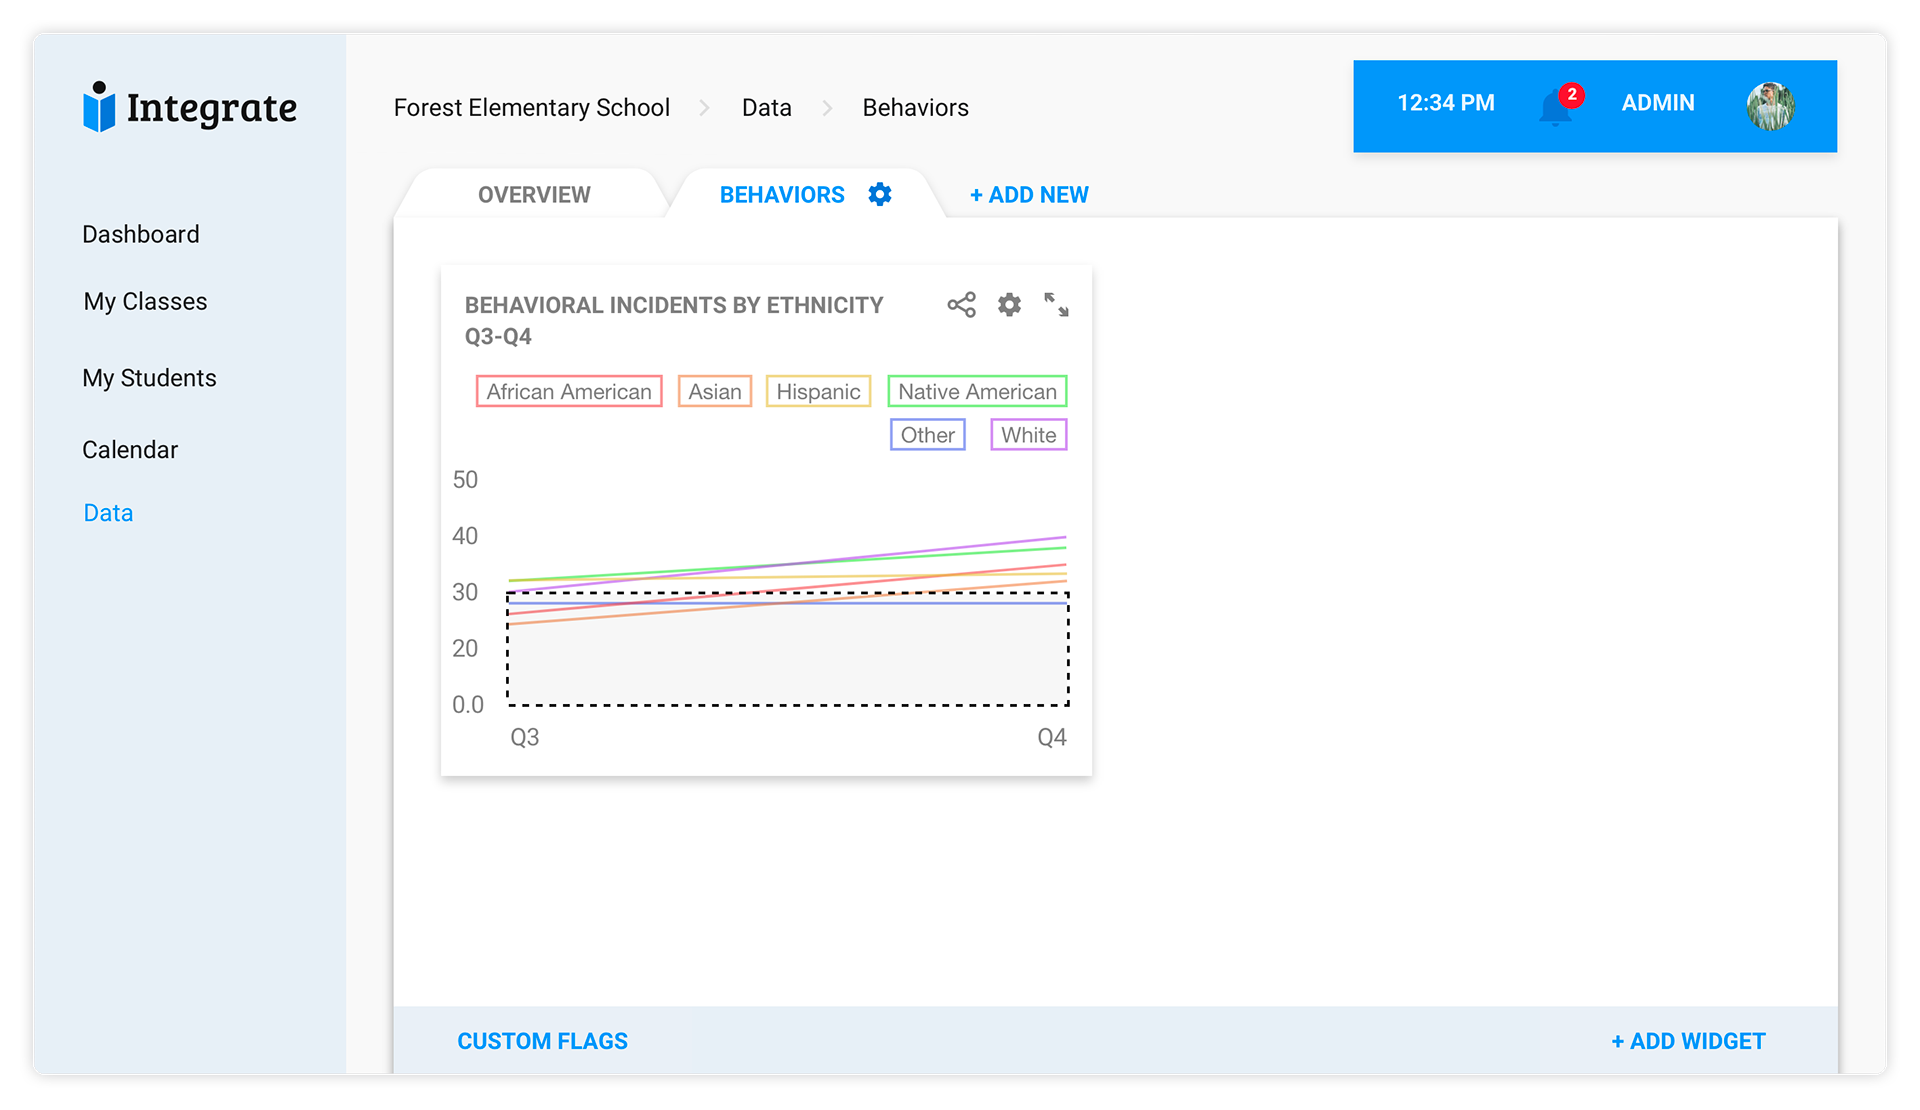
High-Fidelity Prototype
Changes were made and adapted into a third prototype that was visually consistent with the rest of Integrate software. The layouts of the dashboard and widget creation/edit forms were modified in conformity.
↑ Back to Top